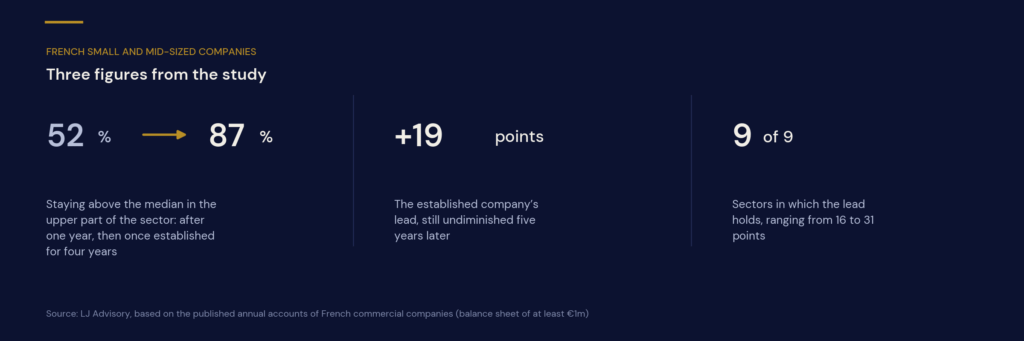
Two companies sit in the most profitable sixth of their sector. The first has stood above the sector median for one financial year; the second, for at least four consecutive years. The probability that each remains above that median over the next two years is 52% for the first and 87% for the second. A company whose return only just exceeds the median, but has done so for four years, carries a 63% probability of staying there. Continuity in a moderate performance signals recurring profitability more reliably than a high return recently achieved.
Annual profitability combines durable components with circumstantial effects. The persistence of returns, and their gradual reversion towards the mean, have long been documented for listed companies; the accounts of French private companies make it possible to measure the scale of the effect. Close to 200,000 sets of annual accounts, tracked through 2025, form the basis of this measurement.
Continuity of performance points to its durability
Among companies whose operating return on assets exceeds the median of their activity division, we measured how long that outperformance had lasted, then observed whether it held over the following two financial years. At comparable rank within the sector, four consecutive years above the median rather than one corresponds to a probability of persistence higher by 24 to 35 percentage points, depending on the ranking band.
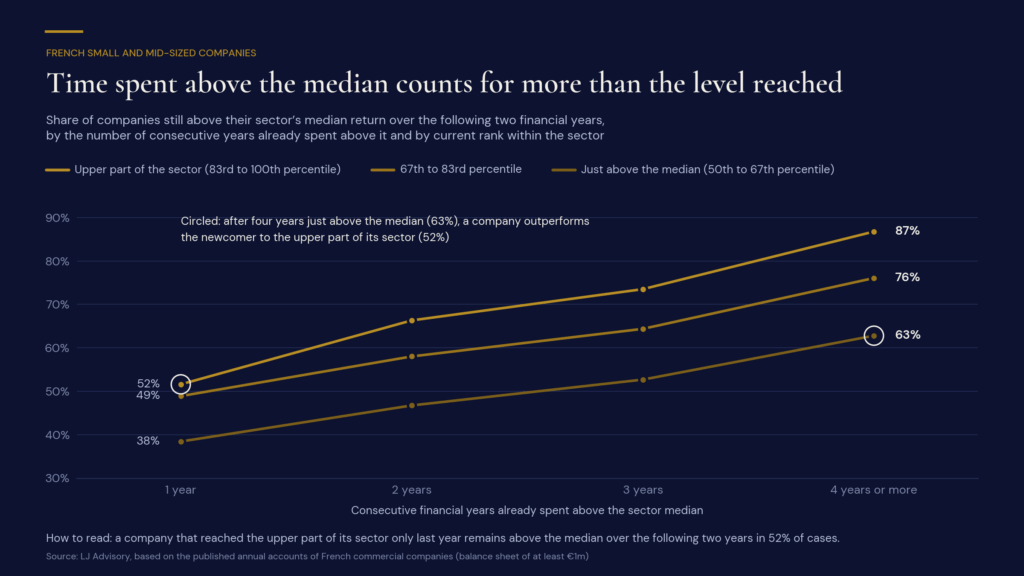
This hierarchy invites a reassessment of the weight given to the latest financial year. A company ranked today in the top sixth of its sector, but whose outperformance dates back only one year, remains above the median over the following two years in 52% of cases. That proportion reaches 63% for a company that exceeds the median only modestly, but has done so for four years. In this comparison, the depth of the track record outweighs the level of profitability reached.
Two checks support this reading. The gap persists when the comparison is restricted to companies that all have four years of history. It remains unchanged, too, when companies are compared at their exact percentile within the sector. Neither the availability of prior accounts nor a better standing within the same band is therefore sufficient to explain the advantage observed.
An advantage that holds over five years
The advantage is not confined to the following two years. At comparable starting rank, companies whose return has exceeded the median for at least four years remain above that threshold in 81% of cases after one year and in 71% of cases after five. For those whose outperformance is recent, the figures are 62% and 52% respectively.
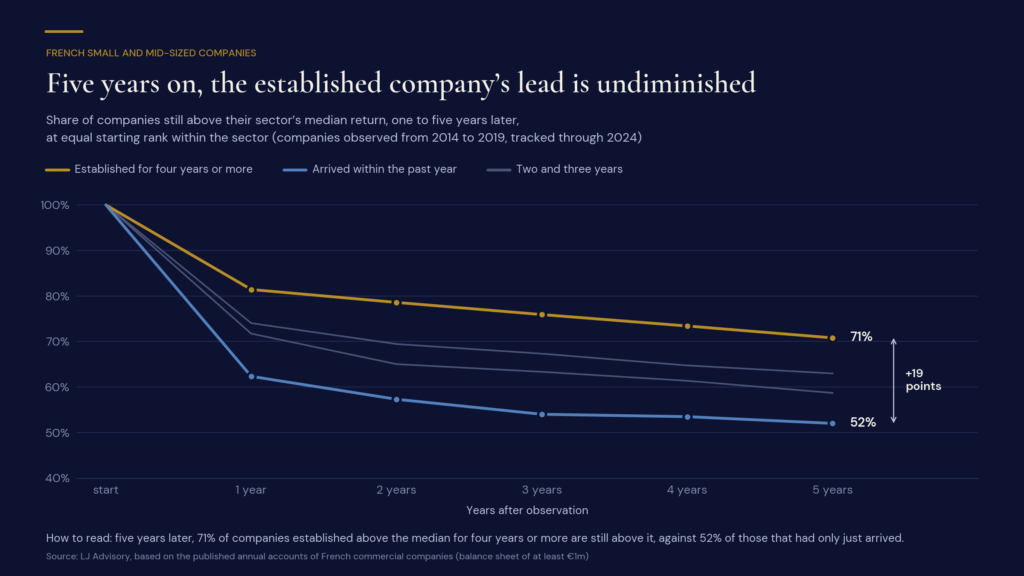
The trajectory of the two groups is as instructive as the gap between them. In the first year alone, the share of companies above the median falls by 38 points where outperformance is recent, against 19 points where it is long established. Over the four years that follow, the decline is around ten points in both groups. This pattern suggests that the transitory components of profitability dissipate quickly, while its recurring base erodes more slowly.
Over a five-year holding period, the 19-point lead observed from the first year therefore loses none of its significance.
A constant, across sectors that differ widely
The continuity of outperformance retains its informational value in each of the nine sectors examined. At comparable rank within the sector, the advantage held by companies with an established record ranges from 16 points in accommodation and food service to 31 points in real estate activities. It reaches 28 points in construction as in information and communication, and 23 points in manufacturing.
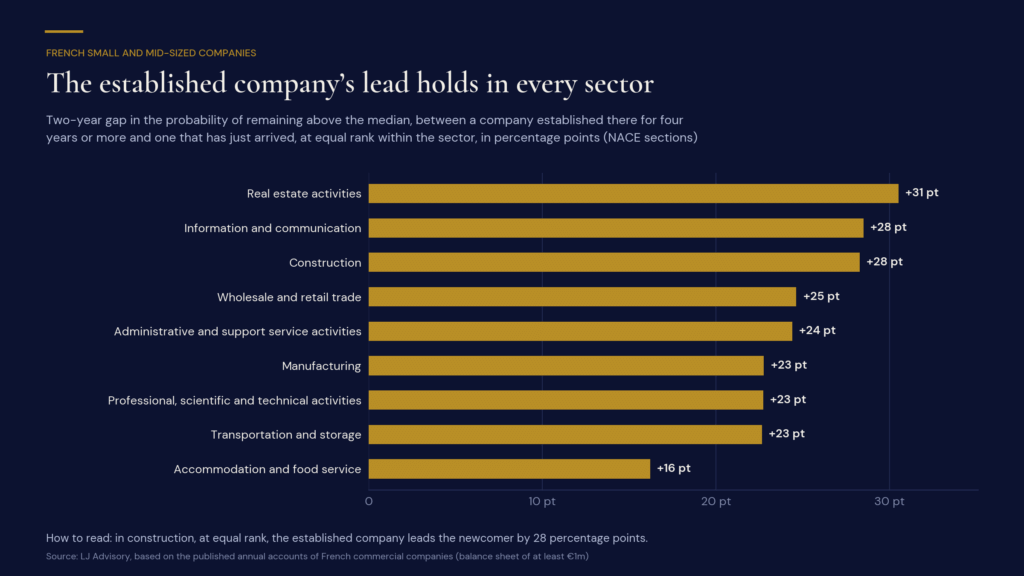
This convergence does not remove the need for a reading specific to each trade. An operating margin of 5% places a company in the upper quartile of motor trade and repair, yet below the median of legal and accounting activities, which stands at 10%. A sector profitability benchmark is therefore built division by division: it is within a single sector that the comparison takes on its full economic meaning.
Beyond the track record, a model trained on the full set of accounts correctly distinguishes, in 87 cases out of 100, a company that sustains its outperformance from one that loses it, against 75 using the current year’s return alone. The indicators that carry this gap belong to the fundamentals of financial analysis: gross operating surplus and earnings relative to assets, operating margin, and asset turnover.
In a transaction: pricing recurring profitability
Whether it derives from comparable transactions or from a sector valuation multiple, price capitalises an earnings capacity assumed to continue. At comparable characteristics, applying the same multiple to a return recently achieved and to one confirmed over four years amounts to crediting both with the same durability. The analysis of earnings recurrence therefore deserves its place in the assessment of price. Three points warrant particular attention.
- Assess the depth of the profitability record. The number of consecutive years above the sector median complements the level of the latest year and substantiates the view taken on its recurrence.
- Qualify the drivers of a recent improvement. A sudden rise in profitability calls for an examination of non-recurring items before a normalised result is settled on.
- Match convergence assumptions to the maturity of the performance. The dissipation of transitory effects and the erosion of recurring profitability follow distinct rhythms. Financial projections gain from reflecting this.
This approach applies to companies whose value rests principally on operating profitability. A company in an investment phase, valued on the strength of its future growth, calls for an assessment suited to its stage of development.
From financial analysis to decision
Acquiring: judging the quality of earnings
In financial due diligence, we position the target’s profitability among its peers, examine the continuity of its outperformance and assess how recurring its recent results are. The normalisation of earnings then rests on a documented record, and price negotiation on a substantiated reading of earnings capacity.
Selling: substantiating the valuation
For a vendor, a return above the sector median sustained over several years is a valuation argument in its own right. We document its level and its continuity in the sale documentation, so as to make the quality of the performance tangible and to support the multiple put forward.
Investing: sharpening selection and portfolio monitoring
For a fund, the continuity of outperformance enriches both target selection criteria and the portfolio review. It separates companies whose profitability follows a proven trajectory from those whose recent performance calls for closer scrutiny. It also places profitability back in its sector context.
Are you preparing an acquisition, a disposal or a portfolio review? LJ Advisory establishes a sector profitability benchmark for the company, analyses its positioning and the recurrence of its returns, to inform the valuation and the terms of the transaction.
Methodology and scope of the study
- Analysis base. One million financial years of French commercial companies whose highest observed balance sheet total reaches at least one million euros, overwhelmingly small and mid-sized companies: full annual accounts from 2012 to 2025, covering twelve-month financial years. Each set of accounts is assessed against the two following years. The size threshold and the sampling rules are specific to this study.
- Operating return on assets. Ratio of operating profit to total assets. The median and the rank are computed each year by division of the French activity classification, revision 2, for divisions with at least thirty companies. As a methodological convention, a ratio of equity to assets at or below 5% results in a ranking below the median.
- Two-year persistence of outperformance. A return on assets above the division median in each of the two following years. An insolvency occurring within that interval is treated as a fall below the median. This indicator measures the persistence of a relative performance.
- Length of outperformance. Number of consecutive years above the median, capped at four. This measure is available for 198,842 sets of accounts whose prior years were filed without interruption.
- Comparison at equal sector rank. Each group is compared with companies in the same ranking decile within their sector and for the same year. The result is unchanged when the comparison is made at percentile level, and likewise on the narrower perimeter of companies with four years of history.
- Stability over time. The gaps are found in each of the three observation periods, ending in 2019, 2022 and 2025.
- Five-year tracking. Companies observed from 2014 to 2019 and tracked through 2024. At the five-year horizon, six companies in ten remain observable, in identical proportions for both groups.
- Sector groupings. Divisions grouped according to the sections of the French statistical classification; nine sectors are examined.
- Model of financial drivers. The model draws on 104 indicators computed from the annual accounts to predict the two-year persistence of the operating return on assets. It is trained on years observed through 2019, then evaluated on the years 2021 to 2025, which were not used in training. The same indicators emerge in 29 to 31 of the 31 sectors studied.
Sources: French activity classification, revision 2 (Insee); The aggregated classification – NA, 2008 (Insee); Towards a new classification: NAF 2025 (Insee). The figures reported are drawn from LJ Advisory’s work on the published annual accounts of French commercial companies.