The last set of accounts filed shows a profit. Positive operating income, revenue growing, no visible warning sign. Three years later, the commercial court opens insolvency proceedings.
This is not a textbook case. Of the 12,924 corporate defaults observed in this study, close to one in four strikes a company that was profitable at its last published year-end. The income statement had not singled them out. Something else had.
That something else is the cash timing gap. And the question at hand, the one every investment committee asks when it looks at a private target, is whether corporate default risk can be identified in time – and whether machine learning, paired here with explainability methods and applied to filed accounts, surfaces signals that conventional analysis misses.
Private companies leave only one trace
A listed company gives warning. The share price falls, analysts revise, the rating deteriorates, and all of it can be read months before the accounts record anything at all. In an equivalent US model, that verdict from the market ranks among the three dominant signals.
A French mid-sized private company gives no such warning. No share price, no rating, no analyst coverage. Filing accounts is not even mandatory for the smallest structures, and confidentiality declarations are common. Only one trace is shared by every target in a pipeline: the accounts filed with the commercial court registry.
That is a constraint, and it is also what makes the exercise interesting. If the signal exists, it lives in the accounts or it exists nowhere.
What was measured, and on what basis
The data: every set of annual accounts filed with the French national business register, amounting to 4.85 million filings from close to 1.15 million private French companies, cross-referenced with 648,623 published notices of insolvency proceedings (procédures collectives) between 2012 and 2025 – of which we retain only the opening of court-supervised reorganisation (redressement judiciaire) and compulsory liquidation (liquidation judiciaire).
The scope: we deliberately narrowed the population. On raw data, micro-enterprises dominate the French sample of defaulting companies. We therefore set a threshold, admittedly arbitrary, retaining only companies with a balance sheet of at least €1 million – below the €2 million statutory threshold that defines a micro-enterprise in French law, but high enough to move away from that population and closer to the pipeline a fund or a trade buyer actually looks at. After this filter, the study covers 1,894,301 sets of accounts filed by 388,074 companies, of which 12,924 defaulted: 3.3% of the retained population.
This 3.3% three-year rate is measured across the full population of companies that file accounts, with no weighting and no matching. It sits within the order of magnitude of published default series, which is the first plausibility check any such figure owes its reader.
The question: not “will this company fail one day”, which helps no one, but “will an opening judgment be handed down within three years” – the horizon on which an investment thesis actually works. That definition is what corporate default risk means throughout what follows. Court-supervised reorganisation or compulsory liquidation, and only the judgment that opens the proceedings. Safeguard proceedings (sauvegarde) are excluded, because they occur before payment default, while the company is still meeting its debts: counting them would classify as a default a company that saw the problem coming. The judgment approving a reorganisation plan is excluded too, but for a different reason: it falls several months after the opening, and retaining it would date the default too late, distorting a measurement conducted within three years of the last filed accounts.
The period: fourteen financial years, through to 2025. The model has therefore lived through the pandemic, the moratoria that suspended insolvency proceedings, and their subsequent resumption.
The test: the model learns on past financial years and is judged only on later years it has never seen. The test covers 283,118 sets of accounts, of which 5,160 precede a default within three years. An additional check: on companies whose accounts the model had never seen at all, performance degrades slightly, without any sharp break.
One defaulting company in four was profitable
23.6% of defaulting companies reported positive operating income at their last published year-end. Three thousand and forty-five companies, in a sample where losses are nonetheless the most common signal.
What sets them apart from profitable companies that survive is neither their margin nor their order book. It is what their activity ties up in cash: the inventory and trade receivables that have to be funded, less the credit obtained from suppliers. The working capital requirement.
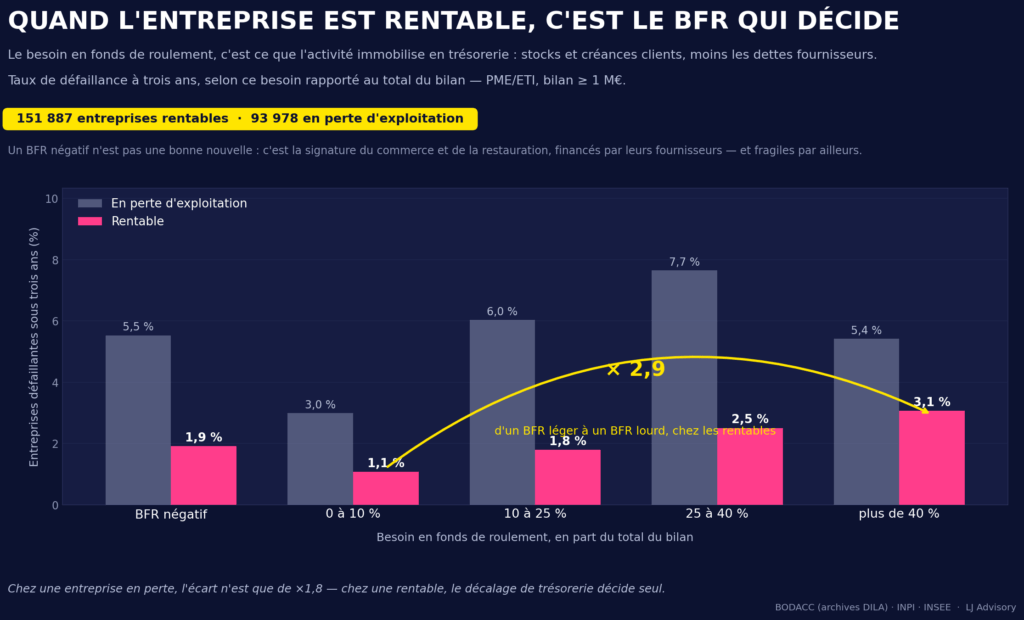
Across 151,887 profitable companies and 93,978 loss-making ones, the reading is unambiguous. For a profitable company, moving from a contained to a high working capital requirement lifts the default rate from 1.1% to 3.1%: risk is multiplied by close to three.
For a loss-making company, the same gap is only 1.8 – and the progression is not even regular. The bottom line already supplies most of the signal; working capital adds a complementary view. In other words: the working capital requirement is not one indicator among many, it is the one that decides the case when the income statement is reassuring. Precisely the situation of a target that clears a committee’s first filter.
One reading not to rush: a negative working capital requirement is not good news. It is the signature of retail and food service, funded by their suppliers and fragile for other reasons. The optimum sits just above zero, not as low as possible.
The signals the corporate default risk model favours
The finding above emerges from the raw data, with no model involved. The question is whether a machine learning model trained without any particular instruction converges on the same reading. It comes close, but the answer is more nuanced than expected.
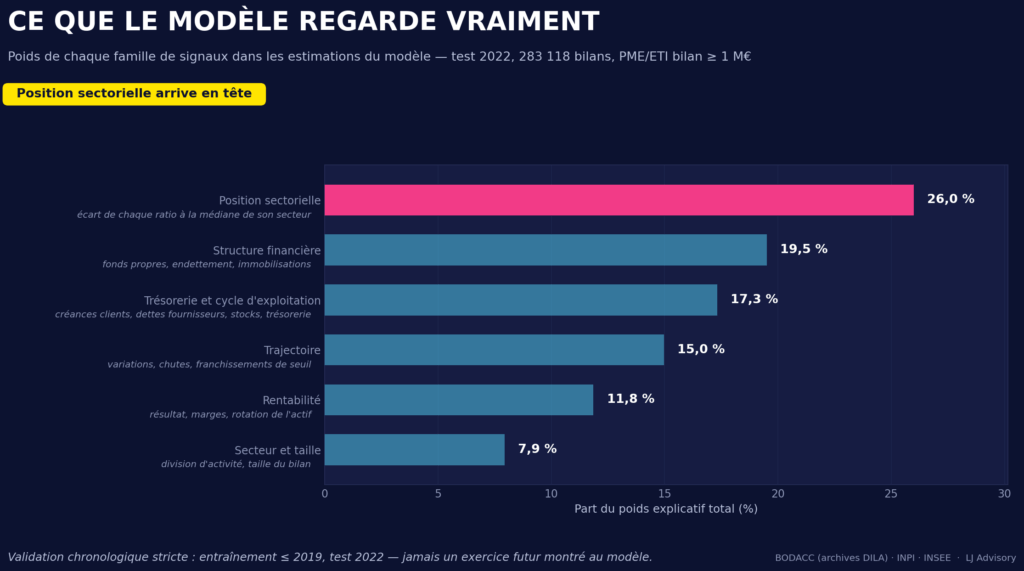
Every estimate can be broken down into the contribution of each accounting line. Aggregated by family across the test period, those contributions produce the ranking above: a company’s position relative to its sector comes first, accounting for 26.0% of explanatory weight, ahead of financial structure (19.5%) and the cash cycle (17.3%). Then come trajectory (15.0%), profitability (11.8%), and raw sector and size markers (7.9%).
One detail in the table deserves attention, because it says more than the ranking itself. Sector position takes first place with eight variables, where trajectory mobilises twenty-nine to extract only 15%. Per indicator used, a ratio’s distance from its sector median is by far the densest signal in the study.
That concentration is not incidental, and it follows from the scope set out above. In micro-enterprises, cash explains almost all of the risk, because there is often nothing else to observe: an underdeveloped financial structure, and a sector comparison that carries little information at that scale. In mid-sized and larger companies, the business already has a structure, a track record and a place within its sector, and those three dimensions come to matter almost as much as the cash timing gap. Assessing a target of that size means reading all three together.
Sector position is worth pausing on: it comes first here, where its contribution was marginal on the unfiltered population. The message it carries is easy to state and easy to neglect in practice: what matters is not the level of a ratio, but its distance from the norm of its sector. A working capital requirement at 20% of the balance sheet is an alarm in publishing and a cruising speed in construction.
Profitability, for its part, comes only second to last, at 11.8%. Not because it is unimportant, but because it is largely redundant with the rest, and above all because it fails to discriminate exactly where discrimination is needed. A loss-making company is picked up by any crude filter. It is the profitable company that has to be sorted, and by construction the bottom line is of no help there.
Construction, the textbook case
The mechanism is visible to the naked eye in one sector. Specialised construction works make up the largest sector population in the study, and the most characteristic financial profile.
| Construction | All other sectors | |
|---|---|---|
| Working capital requirement / balance sheet (median) | 24.7% | 9.1% |
| Trade receivables / assets (median) | 24.5% | 15.1% |
| Companies defaulting within 3 years | 7.5% | 3.0% |
A cash requirement close to three times the rest of the economy, and trade receivables more than half again as large. The trade explains it entirely: work is performed before it is paid for, progress claims settle late, and retention money ties up part of the contract value for a year after handover. The company funds its own customer.
The result is among the most revealing in the study. A profitable construction company carries a 5.2% three-year default risk, against 1.8% for a profitable company in any other sector. Close to three times, at comparable profitability. A full order book and a positive margin do not offset a seized-up collection cycle.
Which sectors concentrate defaults
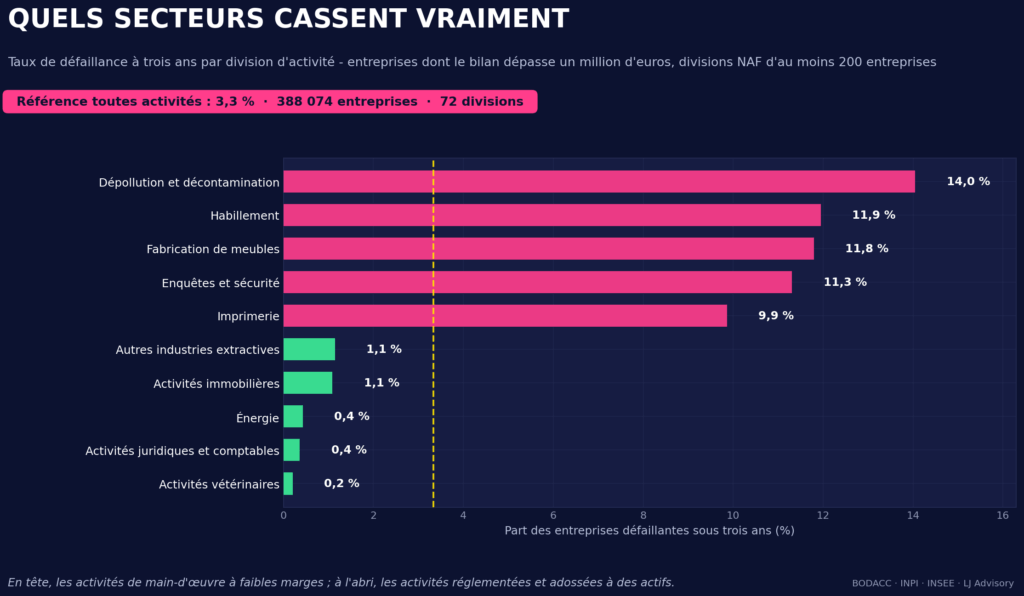
We set out to rank sectors by their exposure to default. The data supplies a ranking, and it supplies something better than a ranking: a dividing line. Five divisions exceed 9.9%, three times the 3.3% average. Five others stay below 1.2%, at least three times under. From one group to the other, the ratio is of the order of ten to one. Within the most exposed group, however, the exact order is debatable: a few hundred companies per division are enough to establish that a division is exposed, but not, in this case, to separate the second from the two that follow. What matters is therefore not whether an activity ranks first or third, but whether it belongs to the group around 10% or the one around 1%.
| Most exposed | Defaults | Most resilient | Defaults |
|---|---|---|---|
| Remediation and decontamination | 14.0% | Veterinary activities | 0.2% |
| Apparel manufacturing | 11.9% | Legal and accounting activities | 0.4% |
| Furniture manufacturing | 11.8% | Energy | 0.4% |
| Investigation and security services | 11.3% | Real estate activities | 1.1% |
| Printing | 9.9% | Other mining and quarrying | 1.1% |
This line does not follow the boundary one might expect, between industry and services. It separates activities whose margin is renegotiated every year – with every order, every tender – from those whose revenue is protected, either by regulation or by an asset. On one side apparel, furniture, printing, security; on the other veterinary practice, legal and accounting, energy, real estate. Companies in the first group default ten times as often as those in the second.
The most exposed

Remediation and decontamination. These companies work on site rehabilitation: asbestos removal, soil and groundwater decontamination, restoration of industrial sites. A contracting trade, sold at a fixed price to public or industrial clients, with regulatory obligations to fund upfront and the balance collected on completion. Fourteen per cent of them were subject to an opening judgment within three years of their last filed accounts: four times the overall average, and the highest rate of the seventy-two divisions retained. The explanation probably lies in the structure rather than the trade: few fixed assets, a working capital requirement that absorbs cash between contracts, and a margin renegotiated at every tender. One clarification: waste collection, sorting and treatment fall under a neighbouring division, made up of substantially larger operators, and are not concerned here.
Apparel, furniture, printing: from 9.9% to 11.9%, three to four times the average. These three divisions share one profile: labour-intensive manufacturing exposed to price competition. Production equipment to depreciate, short runs, a highly price-sensitive customer base, and imports on the other side setting the market price without carrying the same costs. The margin is renegotiated with every order, and there is neither a liquid asset nor bargaining power to absorb a shock. These are not badly run sectors: they are sectors whose business model leaves no margin for error.

The most resilient

The lowest rates sit between 0.2% and 0.4%: veterinary activities, legal and accounting activities, energy.
Each is measured across several hundred to several thousand companies for a very limited number of defaults – not because the sample is too small, but because corporate default is genuinely rare there: regulated professions, inelastic demand, or activity backed by assets and long-term contracts.
These three rates are too close for anyone to claim a ranking among them; what is solid, on the other hand, is that all three sit far below the 3.3% average.
Just above them, one sector is worth a closer look – less for its rank than for what it teaches.
Real estate activities: 1.1%. One company in ninety, against one in thirteen in building construction. The asset ties up substantial capital, but it also serves as security: a building can be refinanced, sold or let, where a specialised machine tool finds a buyer only at a steep discount. Property income absorbs shocks that an industrial cycle would take head-on.

The most instructive contrast, however, is not between the top and the bottom of the ranking, but within a single value chain. Real estate activities lose one company in ninety; construction, which produces the very asset the former go on to hold, loses close to seven times as many. Same building, same economic cycle, two opposite positions: one holds a refinanceable asset and collects rent, the other advances the cash for the site and waits to be paid. It is not the sector that protects, it is the position held in the collection cycle.
This observation reaches well beyond construction. High capital intensity, revenue renegotiated at short intervals, cash advanced by the provider: that triplet describes a good share of the industrial and business-services assets that come across a transaction desk. It is not a sector effect, it is a balance sheet signature, and it calls for the same caution on a target whose sector looks barely exposed.
Negative equity: the most reliable alarm is also the rarest
Trajectory measures weigh less, on average, than structure or sector position. Taken one at a time, some of them nonetheless separate the two populations better than any level does.
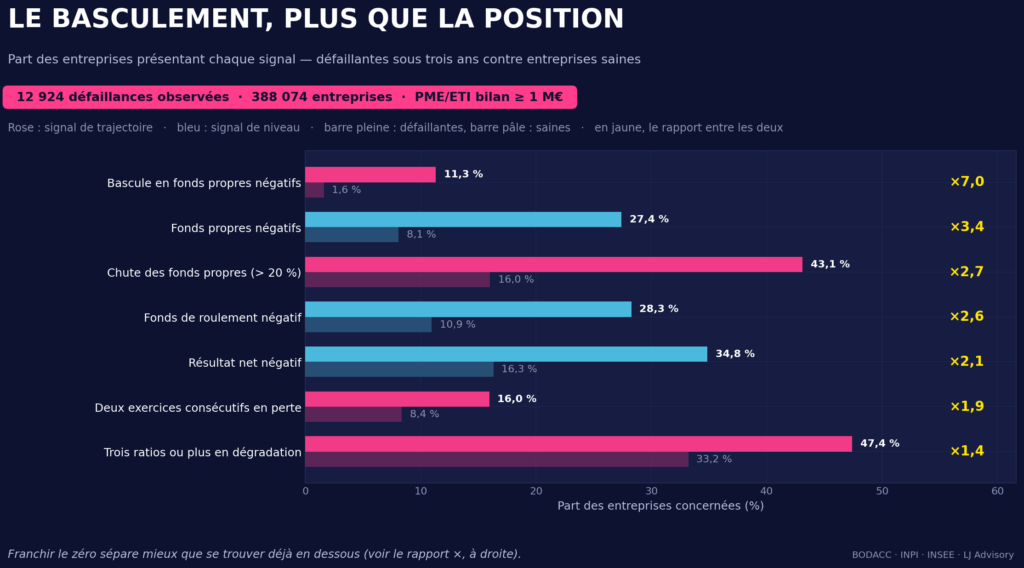
Being in negative equity multiplies the frequency by 3.4 among defaulting companies: 27.4% of them are in that position, against 8.1% of healthy ones. Swinging into it from one year to the next multiplies it by 7.0, the highest ratio in the entire study.
That figure has to be read for what it is. The swing concerns only 11.3% of defaulting companies: when it happens it is close to decisive, and it happens only once in nine cases. It is a highly reliable and infrequent alarm, and that is precisely why it weighs little in the average ranking while deserving an immediate response when it does go off.
The contrast with the bottom of the table says the rest. “Three or more ratios deteriorating” concerns 47.4% of defaulting companies, almost one in two – but also 33.2% of healthy ones, and is therefore worth a ratio of only 1.4. A frequent, weakly discriminating signal on one side, a rare and near-decisive one on the other: what really separates is the crossing of a threshold, not diffuse deterioration.
The practical consequence fits in one sentence: a company that has been consistently mediocre is a business model, not an alert. It is the one that was comfortable three years ago and is merely acceptable today that justifies the extra week of work.
How well does it perform in practice?
Two ways to answer, one technical and one operational.
The technical answer. Presented with two companies, one that defaulted and one that did not, the best model ranks the defaulting one as the riskier 85 times out of 100.
| Model | Ranking accuracy | Corporate defaults caught in the riskiest 20% |
|---|---|---|
| Gradient-boosted decision trees | 85.2% | 74% |
| Random forest | 84.1% | 70% |
| Logistic regression | 81.6% | 67% |
With 12,924 corporate defaults observed, the margin of error falls to three tenths of a point. The gaps are therefore real, and this time clearly established – but they remain modest: a logistic regression stays within four points of the best model. The choice of method does not make the result. The quality of the data does. Machine learning brings no methodological break here: it brings a systematic reading of corporate default risk across a pipeline too wide to be examined file by file.
The operational answer. Review the 20% of files ranked riskiest and you capture 74% of the companies that go on to default, with a precision of 6.7% within that fifth, against 1.8% when opening files at random: close to four times the proportion of defaults.
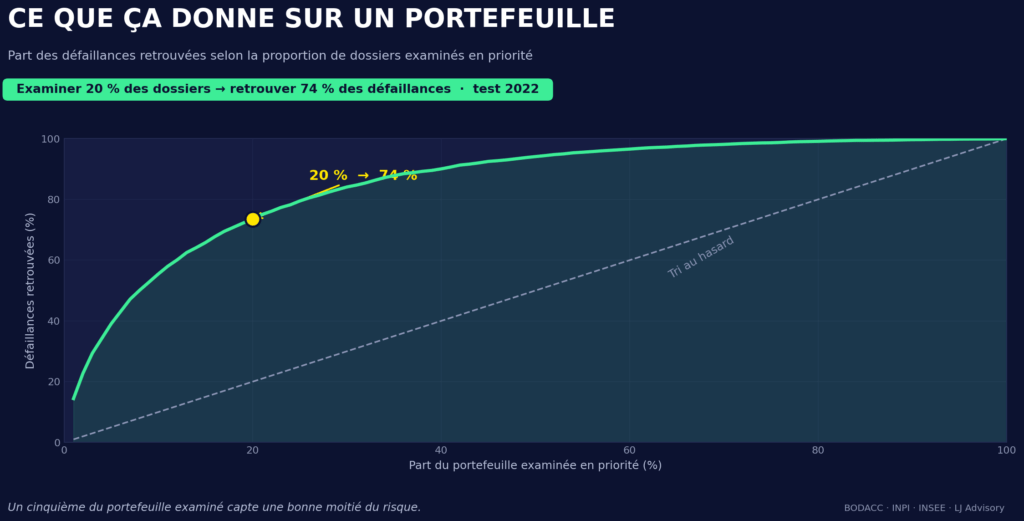
The curve is more useful still at its far end. Within the riskiest 5% of files, one in seven does deteriorate, close to eight times the base default rate. At that level of event rarity, a frequency eight times the reference is exactly what a first screening can offer: precisely the constraint faced by a committee that has to decide within days.
Can these figures go into an investment memo?
With caution, and only if the model has been calibrated for that purpose – a step frequently omitted. A raw score ranks, it does not quantify: it says this company is riskier than that one, and nothing more.
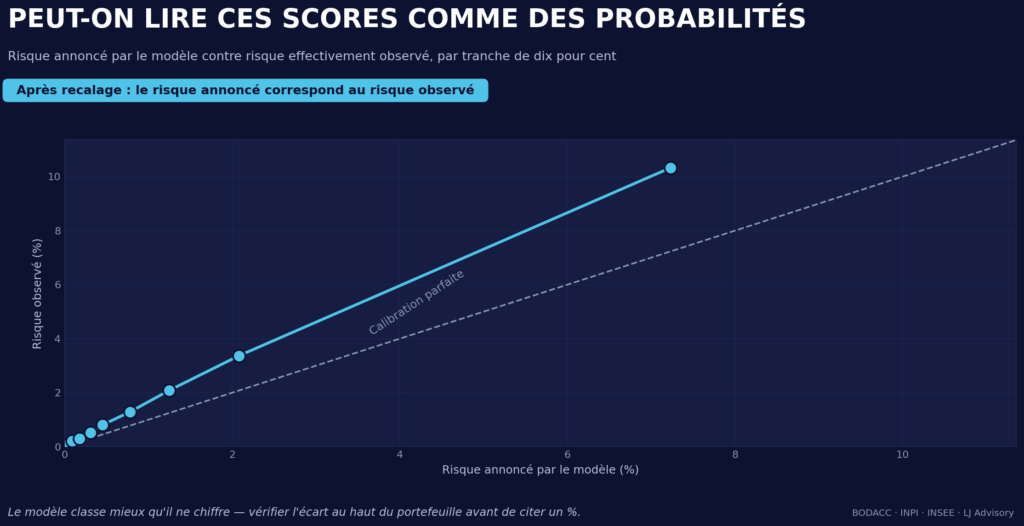
After recalibration, the order of magnitude holds up against the observations, but with a bias better stated than left to be discovered: the model underestimates risk, and it underestimates it more as one moves towards the most exposed tranches of the portfolio. In the most exposed tranche of the test, a stated risk of 7.2% materialises at 10.3%.
The practical consequence is simple. A percentage from this model should be quoted as a floor, not as an exact value: observed reality sits above it, particularly on the riskiest files – which are, precisely, the ones that reach committee. The model ranks better than it quantifies, and that is how it should be used: to order a pipeline and focus attention, not to write a probability of default to the last decimal into a memo.
One file, opened factor by factor
An average ranking indicates what matters in general. A board needs something else: why this file, and on what evidence. A model that answers “risky” without saying why is not wrong, it is unusable, because no committee approves a decision it cannot examine.
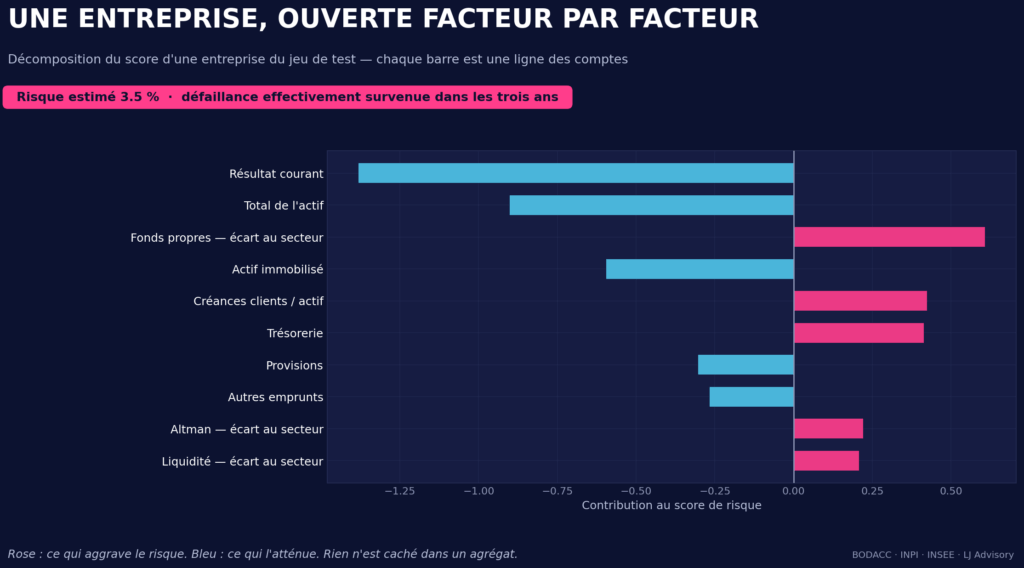
This reads like a credit note, not a model output. Every pink bar is a fact that pushed the company towards default, every blue bar a fact that argued the other way, and the length indicates the weight.
This file illustrates exactly the point of this article, and it also illustrates the caveat in the preceding section: the model assigned it only a 3.5% risk, a modest level, and default nonetheless occurred within three years. Its positive operating profit, the size of its balance sheet and its fixed assets argued in its favour, while equity far below the norm of its sector, an excessive weight of trade receivables and insufficient cash carried the day. A dashboard built on profitability would have let it through without a second look.
Note that the three factors contributing most to the estimated risk are all distances from the sector or cash cycle items, never a level of profit. It is the demonstration, on one case, of what the family ranking says on average.
It is also what makes the conclusion refutable in the field. If the breakdown rests on a line item that the data room reveals to be exceptional, it can be set aside on the evidence rather than on instinct. Every bar is a line in the filed accounts, verifiable by anyone who holds them: nothing rests on the authority of the model.
What this changes at each stage of a transaction
Origination and target search : the French private market is vast and opaque, with no ratings, no coverage, no share price. Filed accounts are the only information available on every target at once. Turning them into a first screen by corporate default risk replaces no judgement; it sets the order in which files are opened. On a list of eighty names, that alone decides how a team spends its weeks. The same screen serves beyond acquisition: ranking by default risk the counterparties one is about to rely on – a strategic customer, a sole supplier, a joint-venture partner – draws on the same reading.
Opportunity analysis : two targets shown at the same EBITDA multiple are not the same asset. The one whose cycle ties up a quarter of the balance sheet will have to fund its growth before collecting the proceeds; the other will not. That gap cannot be read on a multiple, it is read on the balance sheet, and it changes the investment thesis, not merely the price.
Buy-side due diligence: a data room rarely holds more than three financial years. Filed accounts, by contrast, are public and take minutes to obtain: two additional years are often enough to change the reading, and to check that the trajectory presented matches the one that was filed. On long-cycle targets, two points deserve a written question: the seasonality of the working capital requirement, since a year-end at the low point flatters the balance sheet, and the treatment of retention money.
Valuation, structuring and closing: this is where the analysis translates into financial impact. A structurally high working capital requirement is not a price adjustment at the accounts date, it is a permanent capital need, belonging to enterprise value rather than to the net cash calculation. Three negotiating points follow: determine it on a multi-year average rather than on the last year-end, index any earn-out to actual collection rather than to invoiced revenue, and tie the warranty package to receivable line items. The financial history supports each of these points.
What can still be refined
Coverage. The 3.3% rate applies to companies whose accounts are filed and readable. Filings under a confidentiality declaration are flagged by the registry and therefore countable: measuring their share sector by sector is the natural next step. Companies that file no accounts sit, by construction, outside the reach of a model built on accounts.
Scope. The study focuses on companies with total assets above one million euros, the universe a transaction actually draws from. Micro-enterprises, which make up most of the French business fabric, warrant a dedicated study.
Definition and period. Default here means the opening of court-supervised reorganisation or liquidation proceedings; a safeguard procedure that ends in a successful turnaround follows a different logic. The years 2020 and 2021, shaped by the suspension of proceedings (around 25,000 openings in 2021 versus 40,000 to 50,000 in a normal year), feed into the training: weighting them differently is one avenue.
Sectors and horizon. Sector rates are observed frequencies over a given window. Seventy-two divisions carry enough companies; the remaining fifteen, a test above two million euros of total assets and horizons other than three years all call for more observations.
What the data room adds. Management quality, governance, litigation, customer concentration, off-balance-sheet commitments: these often decisive factors surface in due diligence. The model ranks the files; the data room completes them.
Conclusion
One thread runs through the whole study: in the French private market, profitability is not enough to decide the case, once companies are large enough for their financial structure and trajectory to be analysed. Close to one default in four strikes a profitable company, and the working capital requirement multiplies risk there by nearly three. But in mid-sized and larger companies, that cash cycle no longer dominates alone: it shares the explanation with financial structure and with the company’s position against its sector, three readings that now have to be combined rather than played off against one another.
Sectors say the same thing from another angle – not which trades suffer defaults, but which share the same structure. It is not the most capital-intensive that default, it is those whose margin is renegotiated with no asset to cushion the shock: apparel, furniture, printing, security. At the other end, regulated activities or those backed by an asset hold up, with exposure roughly ten times lower – a gap no EBITDA multiple will ever reveal.
For a fund, an M&A director or an adviser, the implication is direct. The income statement sorts profitable files poorly, which is to say precisely the files that reach committee. The balance sheet, set against sector benchmarks, sorts them.
Machine learning, paired here with explainability methods, does not replace credit analysis: it ranks corporate default risk and makes every conclusion traceable back to a line in the accounts. That last point is not incidental. It is what separates a tool a committee uses from a tool it listens to politely before deciding otherwise.
Discussing this on a live file
What we bring to a transaction comes down to three interventions: making a series of financial years genuinely comparable before reading a trend into it, placing a target against its sector rather than in the abstract, and turning a balance sheet weakness into a defensible figure at the negotiating table.
A list of targets to rank by corporate default risk, a normalised working capital requirement contested in negotiation, or a target whose accounts look sound without the file quite convincing, these are matters we work on.
A note on method. The split is chronological, calibration is fitted outside the test period, and every step refuses to produce a result if a check fails. Other choices of size threshold, horizon or split would give other figures, and use under current conditions would require recalibration. None of this constitutes a production credit model, investment advice or a recommendation.
This study was built iteratively with AI assistance, across many versions. Discarded versions failed more often on the data than on the model; what is published here passed every check.
About LJ Advisory
Mergers, acquisitions and capital reallocation for mid-market funds, energy and industrial players, and cross-border shareholders.